Agricultural Workers, All Other
All agricultural workers not listed separately.
On a phone, press and hold a picture to save it to Photos.
opens your phone's share sheet, where you can save both to Photos
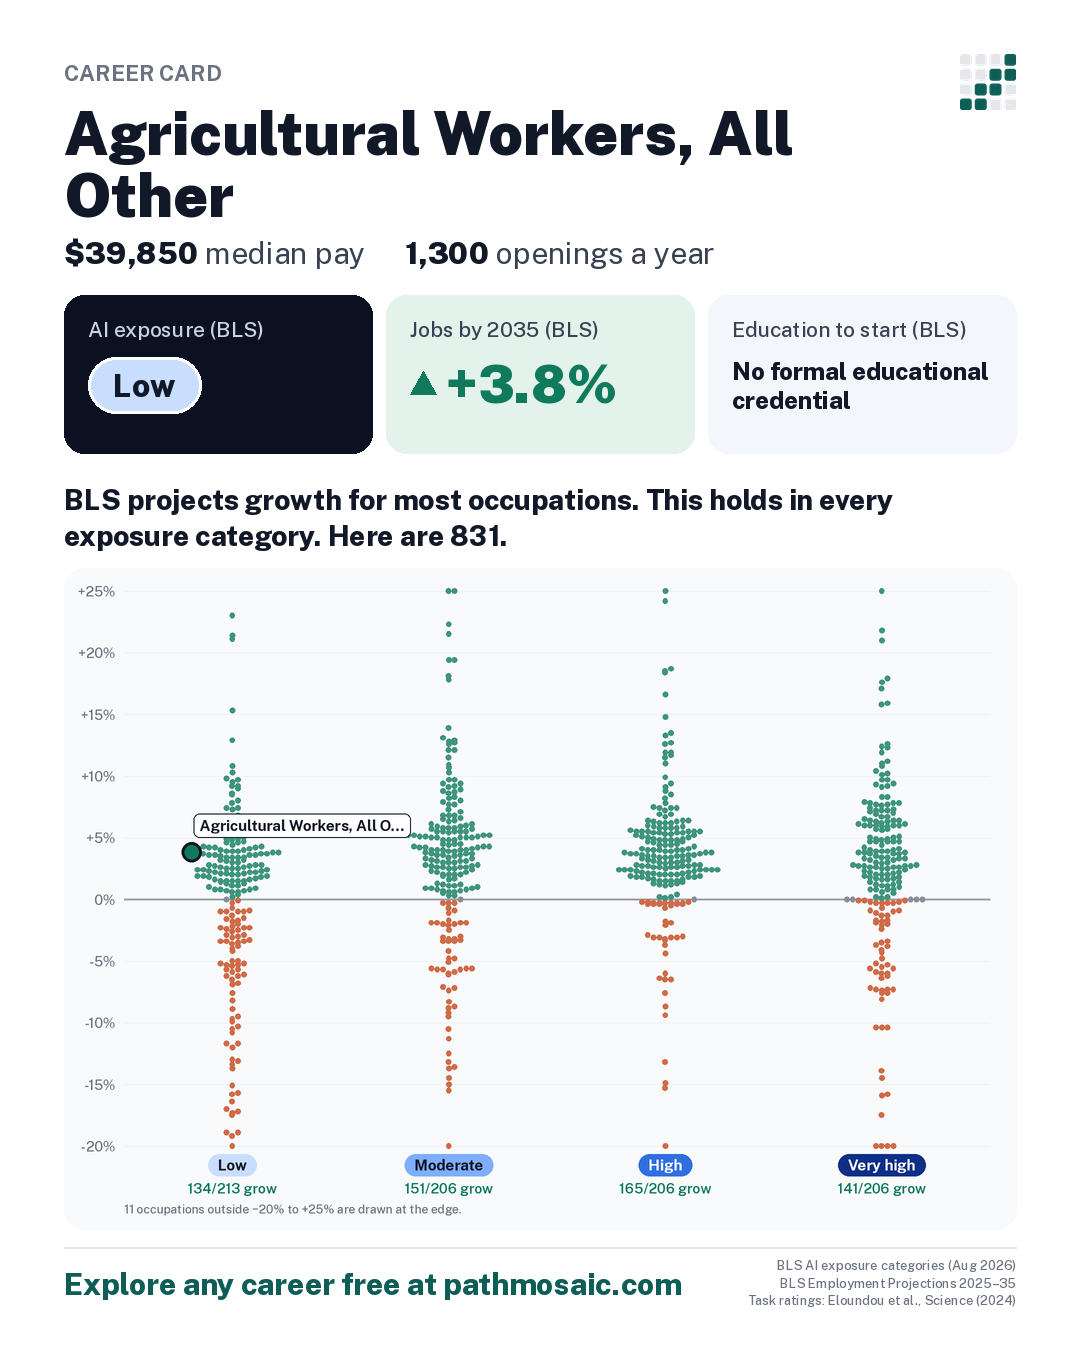
What the data says: Jobs are projected to grow 3.8% by 2035. Its tasks haven't been rated for what AI could do. How to think about this →
About this projection
BLS builds AI into its projections where the research supports it: “BLS generally applies adjustments based on this research conservatively, where there is convincing evidence for a change.”
It also notes a limit: “BLS projection methods are not designed to capture extremely rapid technological change.”
On its AI exposure groups, BLS says exposure “does not imply job loss.”
Recent conditions
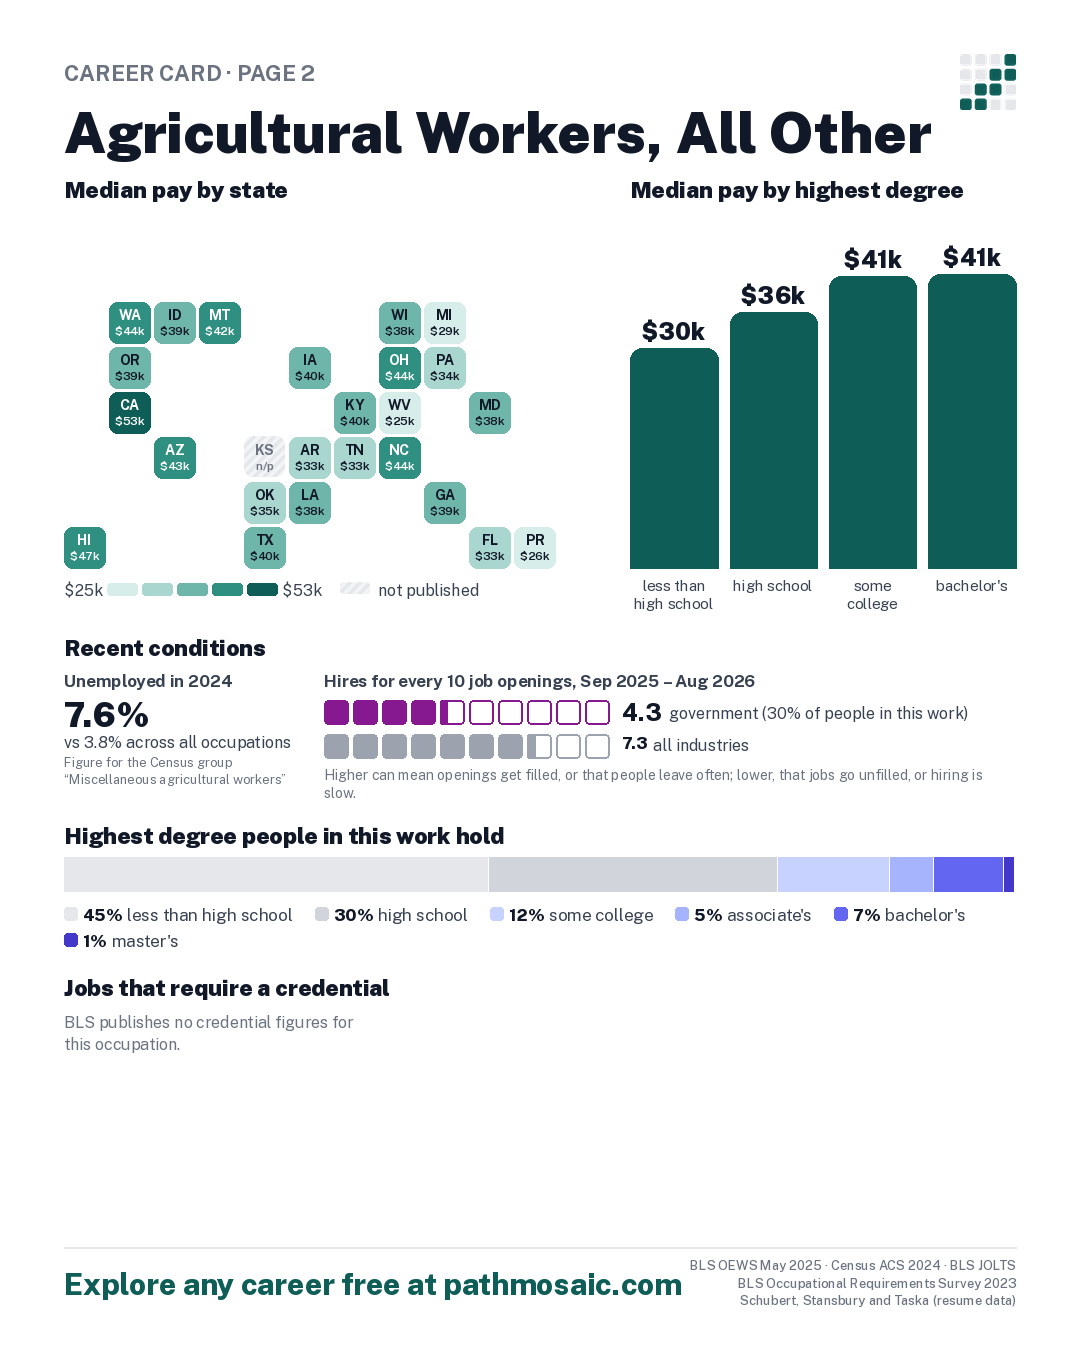
- In 2024, 7.6% of people in this work were unemployed, against 3.8% across all occupations Census ACS 2024, all workers in the Census group “Miscellaneous agricultural workers”
- From Sep 2025 to Aug 2026, 4.3 hires for every 10 job openings in government, which employs about 30% of people in this work, against 7.3 across all industries BLS JOLTS
One box per opening, filled for each hire; hires beyond the openings are added in a lighter shade. Higher can mean openings get filled, or that people leave often; lower, that jobs go unfilled, or hiring is slow.4.3 this industry7.3 all industries
Median pay by state BLS OEWS May 2025, state estimates
Tap a state for its figures.
Median pay in every state
| State | Median | Middle half earn | Jobs |
|---|---|---|---|
| Arizona | $43,350 | $36,050 to $78,830 | not published |
| Arkansas | $33,490 | $30,540 to $46,070 | 220 |
| California | $53,090 | $38,270 to $74,880 | 960 |
| Florida | $33,280 | $31,200 to $36,740 | 100 |
| Georgia | $39,310 | $34,190 to $47,250 | 50 |
| Hawaii | $46,650 | $44,730 to $56,330 | 90 |
| Idaho | $38,790 | $38,030 to $44,360 | 40 |
| Iowa | $40,130 | $38,490 to $43,020 | not published |
| Kansas | not published | not published | 90 |
| Kentucky | $39,970 | $39,970 to $39,970 | 30 |
| Louisiana | $38,160 | $33,120 to $52,990 | 140 |
| Maryland | $37,680 | $36,050 to $43,800 | 180 |
| Michigan | $28,950 | $25,960 to $33,790 | 50 |
| Montana | $42,130 | $37,080 to $49,440 | 80 |
| North Carolina | $43,790 | $38,440 to $62,810 | not published |
| Ohio | $43,540 | $32,200 to $67,800 | 50 |
| Oklahoma | $35,140 | $35,140 to $43,930 | 40 |
| Oregon | $38,930 | $33,090 to $44,320 | 100 |
| Pennsylvania | $33,570 | $32,700 to $35,160 | not published |
| Puerto Rico | $25,720 | $25,690 to $25,720 | 90 |
| Tennessee | $33,080 | $29,090 to $37,210 | 240 |
| Texas | $39,570 | $27,450 to $45,650 | 310 |
| Washington | $43,930 | $36,180 to $63,270 | not published |
| West Virginia | $24,960 | $20,800 to $28,080 | 150 |
| Wisconsin | $37,720 | $35,380 to $37,960 | 50 |
Nationally: $39,850. Shades run from the lowest state median to the highest; a territory below that range takes the lightest. How to read this
How AI touches the work
What AI could speed up, task by task, and where people already use it.
How to read this
Work activities come from O*NET, which links every task to the broader activities it involves. Microsoft's figures are for the activity across everyone who used Copilot, not for agricultural workers, all other specifically. Copilot is a general chat assistant; dedicated coding tools are not included, so programming help is under-counted here. Activities are listed by how many of this occupation's tasks fall under them.
The task ratings say whether AI could halve the time a task takes: on its own (“AI alone”), or with software built on it (“AI + software”). They were made by people in 2023 (Eloundou et al.). Claude's share is the task's share of all Claude.ai conversations in May 2026; Anthropic doesn't publish a task with too few conversations. None of these add up to the BLS exposure group, which combines five research measures.
More in the Guide: task ratings · task order · work activities · Copilot figures · Claude
High exposure doesn't mean fewer jobs
BLS projects most occupations in its two most exposed groups to grow: 141 of 206 rated Very high and 165 of 206 rated High. Each dot is one of the 831 occupations BLS rates.
Career moves into and out of this occupation
From moves between occupations found in online resumes, 2002–2016. Career changes only: a first job after school isn't a move.
Where people moved in from
of 312 moves in
- 1 Medical Equipment Preparers Low +10.8% 32%
- 2 Mobile Heavy Equipment Mechanics, Except Engines Low +6.7% 6%
- 3 Food Service Managers Moderate +5.8% 5%
- 4 Financial Managers Very high +9.7% 3%
- 5 Sales Representatives, Wholesale and Manufacturing, Except Technical and Scientific Products Very high -0.9% 3%
Resumes over-represent younger, white-collar job-seekers and moves into management. Schubert, Stansbury and Taska (resume data).
Education and training for the occupation
Census survey (American Community Survey)
- 45% less than high school
- 30% high school
- 12% some college
- 5% associate's
- 7% bachelor's
- 1% master's
Census ACS 2024, all workers in the Census group “Miscellaneous agricultural workers” · 7,981 people surveyed.
Median pay by highest degree full-time, year-round · Census ACS 2024, all workers in the Census group “Miscellaneous agricultural workers”
Jobs that require a credential BLS Occupational Requirements Survey 2023
BLS publishes no credential figures for this occupation.
Look up certifications, training and licenses U.S. Department of Labor
- Certification Finder ↗ certifications CareerOneStop lists for this occupation
- Training Finder ↗ schools and programs, nationwide; narrow the place there
- License Finder ↗ licenses by state
- Apprenticeships: DOL's list of apprenticeable occupations doesn't include this one.
These open in a new tab and send only the occupation's public code. More in the Guide
BLS AI exposure categories (Aug 2026) · BLS Employment Projections 2025–35 · O*NET 31.0 · Task ratings: Eloundou et al., Science (2024) · Microsoft "Working with AI" v1.1 · Anthropic Economic Index (2026-06-26) · Schubert, Stansbury and Taska · NCES CIP–SOC · Census ACS 2024 · BLS JOLTS
See it online, and explore any career: https://www.pathmosaic.com/card/45-2099.00