Cooks, Institution and Cafeteria
Also called: Cafeteria Cook, Cook, Dietary Cook, School CookPrepare and cook large quantities of food for institutions, such as schools, hospitals, or cafeterias.
On a phone, press and hold a picture to save it to Photos.
opens your phone's share sheet, where you can save both to Photos
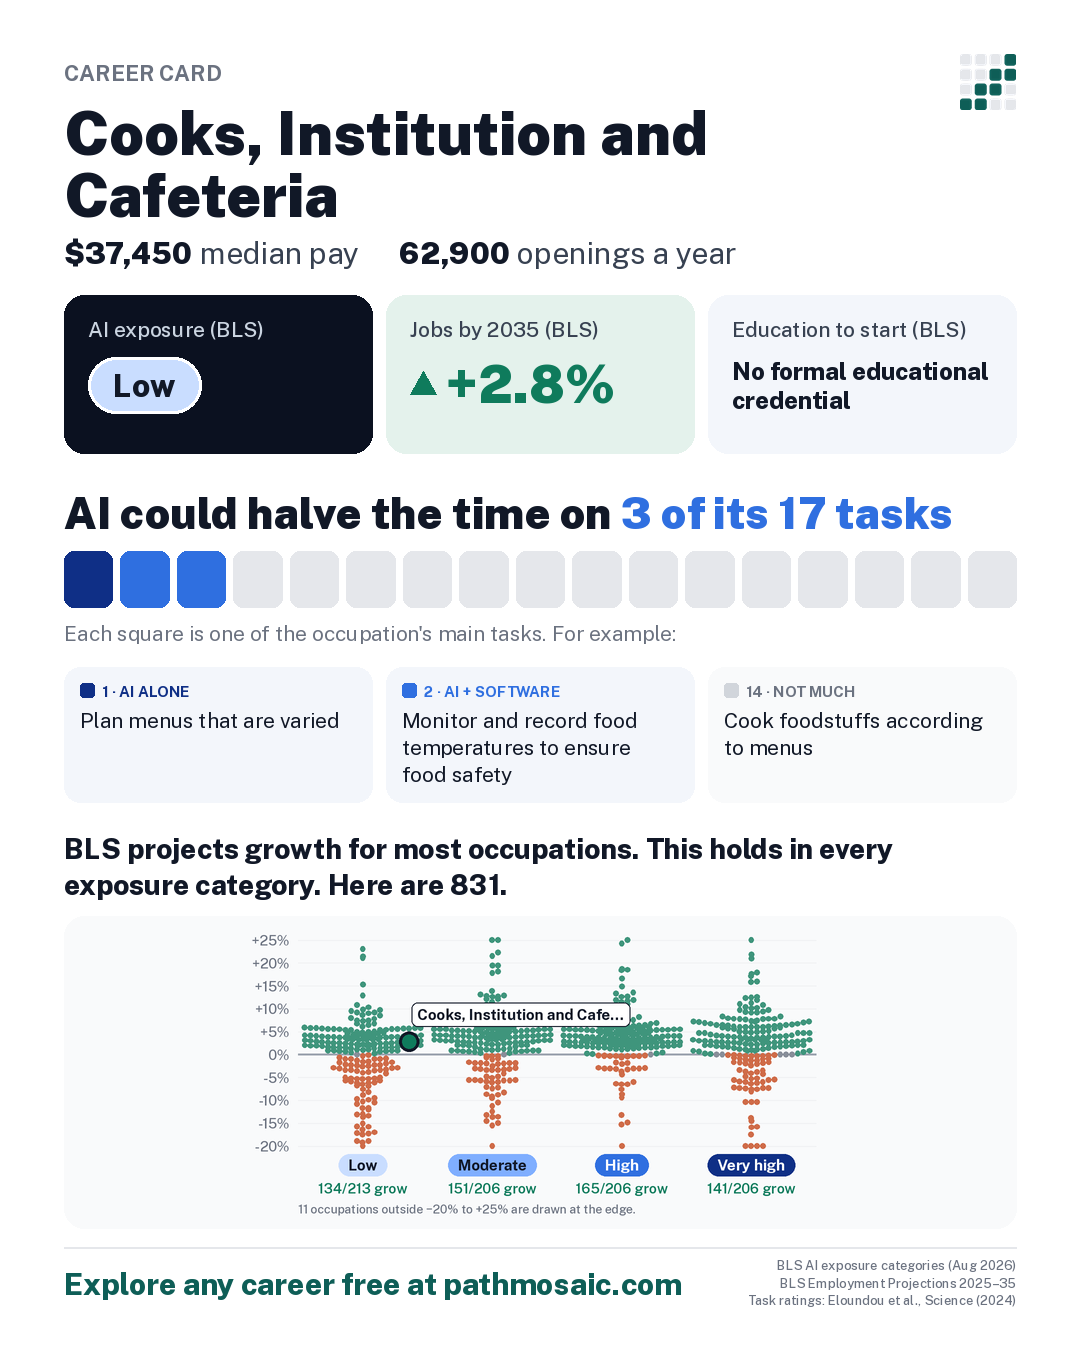
What the data says: AI could halve the time on 3 of its 17 tasks, and jobs are projected to grow 2.8% by 2035. How to think about this →
About this projection
BLS builds AI into its projections where the research supports it: “BLS generally applies adjustments based on this research conservatively, where there is convincing evidence for a change.”
It also notes a limit: “BLS projection methods are not designed to capture extremely rapid technological change.”
On its AI exposure groups, BLS says exposure “does not imply job loss.”
Recent conditions
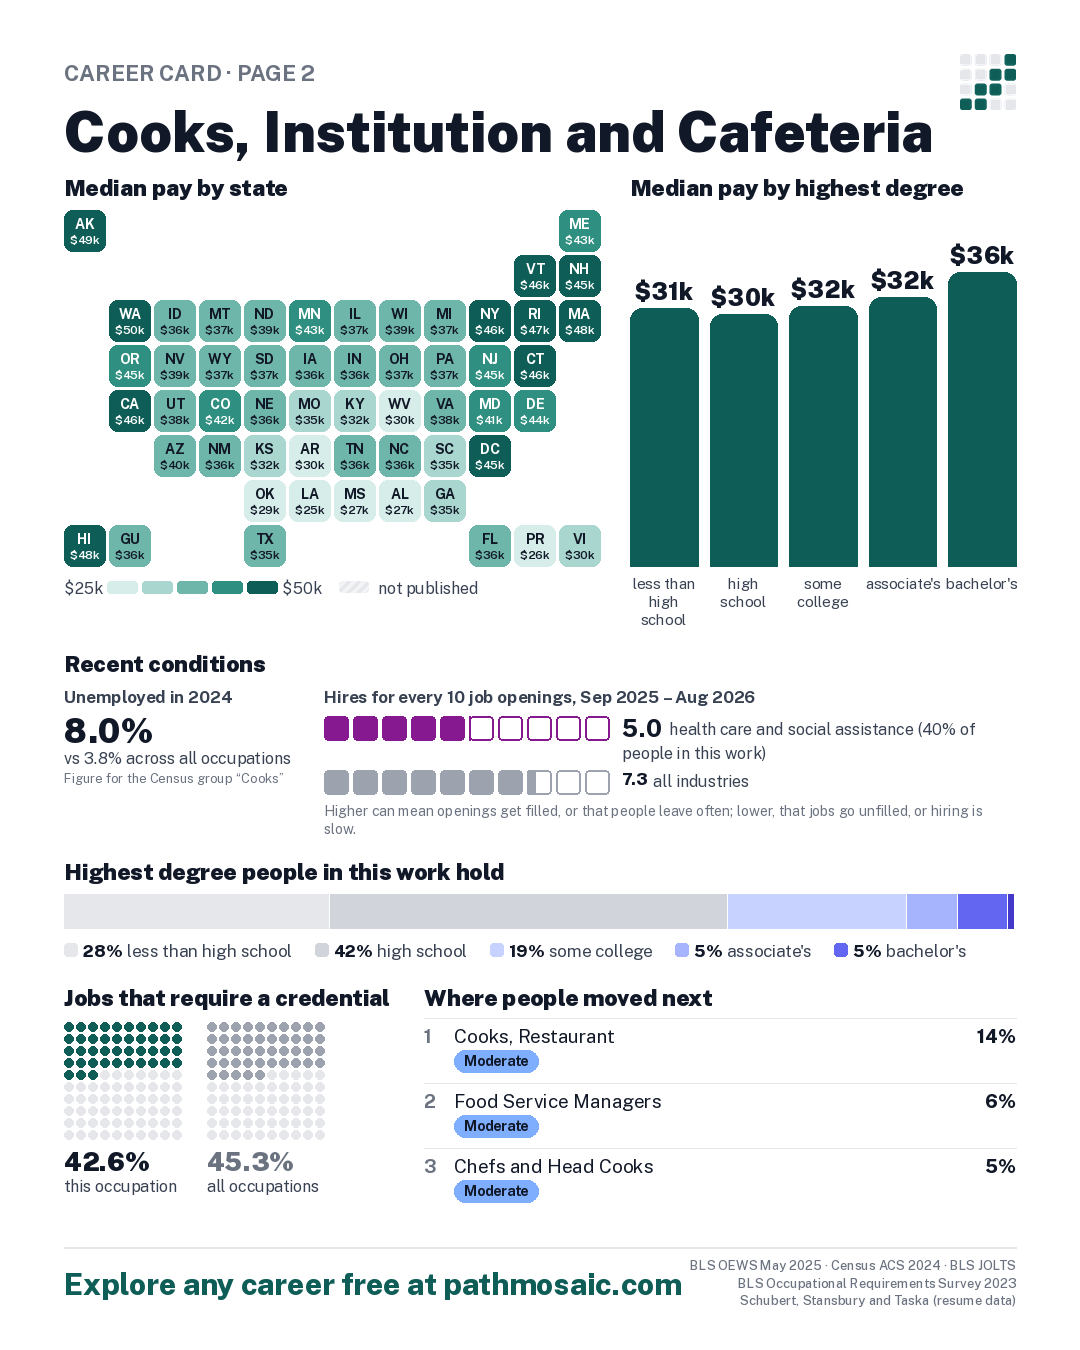
- In 2024, 8.0% of people in this work were unemployed, against 3.8% across all occupations Census ACS 2024, all workers in the Census group “Cooks”
- From Sep 2025 to Aug 2026, 5.0 hires for every 10 job openings in health care and social assistance, which employs about 40% of people in this work, against 7.3 across all industries BLS JOLTS
One box per opening, filled for each hire; hires beyond the openings are added in a lighter shade. Higher can mean openings get filled, or that people leave often; lower, that jobs go unfilled, or hiring is slow.5.0 this industry7.3 all industries
Median pay by state BLS OEWS May 2025, state estimates
Tap a state for its figures.
Median pay in every state
| State | Median | Middle half earn | Jobs |
|---|---|---|---|
| Alabama | $27,120 | $21,630 to $33,300 | 8,780 |
| Alaska | $48,580 | $45,740 to $53,470 | 1,430 |
| Arizona | $39,660 | $36,730 to $45,950 | 7,170 |
| Arkansas | $30,240 | $28,300 to $35,300 | 6,530 |
| California | $46,390 | $40,240 to $52,060 | 31,660 |
| Colorado | $42,500 | $38,450 to $47,920 | 9,440 |
| Connecticut | $46,120 | $39,960 to $48,990 | 4,500 |
| Delaware | $44,080 | $39,620 to $46,050 | 2,680 |
| District of Columbia | $45,450 | $39,980 to $46,950 | 1,500 |
| Florida | $36,250 | $34,480 to $39,840 | 25,100 |
| Georgia | $35,090 | $30,220 to $38,250 | 8,220 |
| Guam | $35,540 | $27,430 to $36,500 | 100 |
| Hawaii | $47,770 | $41,180 to $59,200 | 1,570 |
| Idaho | $35,600 | $30,730 to $39,010 | 3,650 |
| Illinois | $37,440 | $34,560 to $43,280 | 22,840 |
| Indiana | $35,980 | $31,080 to $38,480 | 11,130 |
| Iowa | $35,810 | $30,970 to $37,920 | 8,860 |
| Kansas | $31,950 | $28,840 to $36,030 | 7,570 |
| Kentucky | $31,550 | $28,880 to $37,370 | 11,540 |
| Louisiana | $25,490 | $22,290 to $30,410 | 5,740 |
| Maine | $43,490 | $38,130 to $47,520 | 1,790 |
| Maryland | $41,380 | $37,360 to $46,700 | 3,370 |
| Massachusetts | $47,790 | $45,080 to $51,650 | 7,430 |
| Michigan | $36,870 | $33,360 to $39,660 | 13,500 |
| Minnesota | $43,460 | $37,840 to $46,590 | 7,890 |
| Mississippi | $27,390 | $23,100 to $29,740 | 6,420 |
| Missouri | $34,900 | $29,850 to $38,000 | 13,130 |
| Montana | $37,150 | $33,540 to $42,900 | 2,290 |
| Nebraska | $36,390 | $34,040 to $39,370 | 4,410 |
| Nevada | $39,430 | $36,080 to $46,440 | 1,650 |
| New Hampshire | $45,370 | $39,820 to $49,500 | 1,720 |
| New Jersey | $44,520 | $37,590 to $48,090 | 7,490 |
| New Mexico | $36,470 | $32,330 to $39,700 | 3,160 |
| New York | $45,880 | $38,750 to $51,530 | 17,670 |
| North Carolina | $36,140 | $31,290 to $39,610 | 11,170 |
| North Dakota | $39,490 | $36,330 to $46,340 | 1,820 |
| Ohio | $36,720 | $33,090 to $39,310 | 23,440 |
| Oklahoma | $29,270 | $24,960 to $35,160 | 10,790 |
| Oregon | $44,520 | $38,370 to $49,280 | 7,150 |
| Pennsylvania | $36,540 | $31,160 to $41,020 | 24,490 |
| Puerto Rico | $26,260 | $22,290 to $29,250 | 7,000 |
| Rhode Island | $46,570 | $40,360 to $48,550 | 1,190 |
| South Carolina | $34,960 | $29,130 to $37,250 | 7,850 |
| South Dakota | $36,730 | $32,200 to $40,980 | 2,120 |
| Tennessee | $35,570 | $30,150 to $38,860 | 10,680 |
| Texas | $35,360 | $29,170 to $38,910 | 24,740 |
| Utah | $38,200 | $35,640 to $45,480 | 5,610 |
| Vermont | $46,370 | $41,920 to $48,620 | 1,330 |
| Virgin Islands | $30,440 | $26,440 to $30,970 | 110 |
| Virginia | $37,890 | $34,920 to $44,460 | 11,170 |
| Washington | $49,670 | $45,760 to $58,220 | 9,780 |
| West Virginia | $29,740 | $27,740 to $35,680 | 4,420 |
| Wisconsin | $38,650 | $36,040 to $44,300 | 9,890 |
| Wyoming | $36,940 | $31,960 to $39,900 | 1,570 |
Nationally: $37,450. Shades run from the lowest state median to the highest; a territory below that range takes the lightest. How to read this
How AI touches the work
What AI could speed up, task by task, and where people already use it.
AI could halve the time on 3 of its 17 tasks
| AI rating | Its main tasks | Share of Claude conversations May 2026 |
|---|---|---|
| AI + software | Monitor and record food temperatures to ensure food safety. | Not published |
| Not much | Cook foodstuffs according to menus, special dietary or nutritional restrictions, or numbers of portions to be served. | Not published |
| Not much | Clean and inspect galley equipment, kitchen appliances, and work areas to ensure cleanliness and functional operation. | Not published |
| Not much | Clean, cut, and cook meat, fish, or poultry. | Not published |
| Not much | Rotate and store food supplies. | Not published |
| Not much | Wash pots, pans, dishes, utensils, or other cooking equipment. | Not published |
See all 17 tasks
| Not much | Apportion and serve food to facility residents, employees, or patrons. | Not published |
| Not much | Train new employees. | Not published |
| Not much | Direct activities of one or more workers who assist in preparing and serving meals. | Not published |
| Not much | Take inventory of supplies and equipment. | Not published |
| Not much | Requisition food supplies, kitchen equipment, and appliances, based on estimates of future needs. | Not published |
| AI + software | Compile and maintain records of food use and expenditures. | under 0.01% |
| Not much | Monitor use of government food commodities to ensure that proper procedures are followed. | Not published |
| Not much | Bake breads, rolls, or other pastries. | Not published |
| AI alone | Plan menus that are varied, nutritionally balanced, and appetizing, taking advantage of foods in season and local availability. | 0.02% |
| Not much | Monitor menus and spending to ensure that meals are prepared economically. | Not published |
| Not much | Determine meal prices, based on calculations of ingredient prices. | Not published |
Ordered by how important O*NET's respondents rate each task (1 to 5) times the share who say it is part of their job. The ordering is ours. 2 of the 17 have a published share of Claude conversations; “not published” means too few conversations for Anthropic to publish a figure.
Where people already use AI
The tasks above say what AI could speed up. This shows what people are using it for. Its 17 tasks fall under 15 work activities that many occupations share, and Microsoft counted how often each one came up in 200,000 conversations with its Copilot assistant in 2024.
- #36 Purchase goods or services
- #39 Determine values or prices of goods or services
| Work activity | This occupation's tasks under it | People asked AI for help in 10,000 conversations |
AI did it for them in 10,000 conversations |
|---|---|---|---|
| Prepare foods or beverages | |||
| Monitor operations to ensure adequate performance | |||
| Maintain operational records | |||
| Inspect facilities or equipment | |||
| Replenish inventories of materials, equipment, or products | |||
| Purchase goods or services | |||
| Determine values or prices of goods or services | |||
| Develop recipes or menus |
Show all 15 activities
| Clean workpieces, finished products, or other objects | |||
| Clean tools, equipment, facilities, or work areas | |||
| Direct organizational operations, activities, or procedures | |||
| Train others on operational or work procedures | |||
| Provide food or beverage services | |||
| Move materials, equipment, or supplies | |||
| Stock supplies or products |
How people in this work use Claude
What people in this work made with Claude % of conversations
- A recipe or meal plan69%
- Data or a spreadsheet8%
- A document or report6%
- An app or website5%
- Ideas or a brainstorm2%
How they worked with Claude
6% of these conversations were about work. Anthropic Economic Index, May 2026.
How to read this
Work activities come from O*NET, which links every task to the broader activities it involves. Microsoft's figures are for the activity across everyone who used Copilot, not for cooks, institution and cafeteria specifically. Copilot is a general chat assistant; dedicated coding tools are not included, so programming help is under-counted here. Activities are listed by how many of this occupation's tasks fall under them.
The task ratings say whether AI could halve the time a task takes: on its own (“AI alone”), or with software built on it (“AI + software”). They were made by people in 2023 (Eloundou et al.). Claude's share is the task's share of all Claude.ai conversations in May 2026; Anthropic doesn't publish a task with too few conversations. None of these add up to the BLS exposure group, which combines five research measures.
More in the Guide: task ratings · task order · work activities · Copilot figures · Claude
High exposure doesn't mean fewer jobs
BLS projects most occupations in its two most exposed groups to grow: 141 of 206 rated Very high and 165 of 206 rated High. Each dot is one of the 831 occupations BLS rates.
Career moves into and out of this occupation
From moves between occupations found in online resumes, 2002–2016. Career changes only: a first job after school isn't a move.
Where people moved next
of 2,054 moves out
- 1 Cooks, Restaurant Moderate +12.1% 14%
- 2 Food Service Managers Moderate +5.8% 6%
- 3 Chefs and Head Cooks Moderate +6.6% 5%
- 4 Cashiers High -6.5% 4%
- 5 Managers, All Other (2010 group) an older group BLS has since split; no exposure group today 4%
Where people moved in from
of 1,974 moves in
- 1 Cooks, Restaurant Moderate +12.1% 23%
- 2 Cashiers High -6.5% 7%
- 3 Food Service Managers Moderate +5.8% 7%
- 4 Fast Food and Counter Workers Moderate +5.8% 6%
- 5 Chefs and Head Cooks Moderate +6.6% 3%
Resumes over-represent younger, white-collar job-seekers and moves into management. Schubert, Stansbury and Taska (resume data).
Education and training for the occupation
O*NET survey of workers in this occupation
- 2% less than high school
- 71% high school
- 14% postsecondary certificate
- 6% some college
- 7% bachelor's
O*NET 31.0 survey of workers in this occupation · 41 people answered.
Census survey (American Community Survey)
- 28% less than high school
- 42% high school
- 19% some college
- 5% associate's
- 5% bachelor's
- 1% master's
Census ACS 2024, all workers in the Census group “Cooks” · 20,501 people surveyed.
Why the two can differ
O*NET asks about 20 people in each occupation, which makes its shares uncertain, but it reports the exact occupation and counts certificates. The Census survey reaches thousands, but it groups some occupations together and counts degrees only. More in the Guide
Median pay by highest degree full-time, year-round · Census ACS 2024, all workers in the Census group “Cooks”
4 programs, such as Cooking and Related Culinary Arts, General, Food Preparation/Professional Cooking/Kitchen Assistant and Institutional Food Workers.
See all
- Cooking and Related Culinary Arts, General
- Food Preparation/Professional Cooking/Kitchen Assistant
- Institutional Food Workers
- Foodservice Systems Administration/Management
Jobs that require a credential BLS Occupational Requirements Survey 2023
42.6% this occupation
45.3% all occupations
| By kind | This occupation | All occupations |
|---|---|---|
| a license | <0.5% | 19.1% |
| a certification | not published | |
| an educational certificate | not published |
Share of jobs whose employer requires it. BLS doesn't say which credential. How to read this
Look up certifications, training and licenses U.S. Department of Labor
- Certification Finder ↗ certifications CareerOneStop lists for this occupation
- Training Finder ↗ schools and programs, nationwide; narrow the place there
- License Finder ↗ licenses by state
- Apprenticeship Finder ↗ DOL lists 2 registered apprenticeships in this occupation (COOK (Any Ind) (Alternate Title: Nutrition Care Specialist); COOK (Any Ind) (Alternate Title: Nutrition Care Specialist)). Apprenticeship.gov can't be linked to one occupation, so search for “Cooks, Institution and Cafeteria” there.
These open in a new tab and send only the occupation's public code. More in the Guide
BLS AI exposure categories (Aug 2026) · BLS Employment Projections 2025–35 · O*NET 31.0 · Task ratings: Eloundou et al., Science (2024) · Microsoft "Working with AI" v1.1 · Anthropic Economic Index (2026-06-26) · Schubert, Stansbury and Taska · NCES CIP–SOC · Census ACS 2024 · BLS JOLTS
See it online, and explore any career: https://www.pathmosaic.com/card/35-2012.00