Survey Researchers
Also called: Research Associate, Research Scientist, Survey Methodologist, Survey ResearcherPlan, develop, or conduct surveys. May analyze and interpret the meaning of survey data, determine survey objectives, or suggest or test question wording. Includes social scientists who primarily design questionnaires or supervise survey teams.
On a phone, press and hold a picture to save it to Photos.
opens your phone's share sheet, where you can save both to Photos
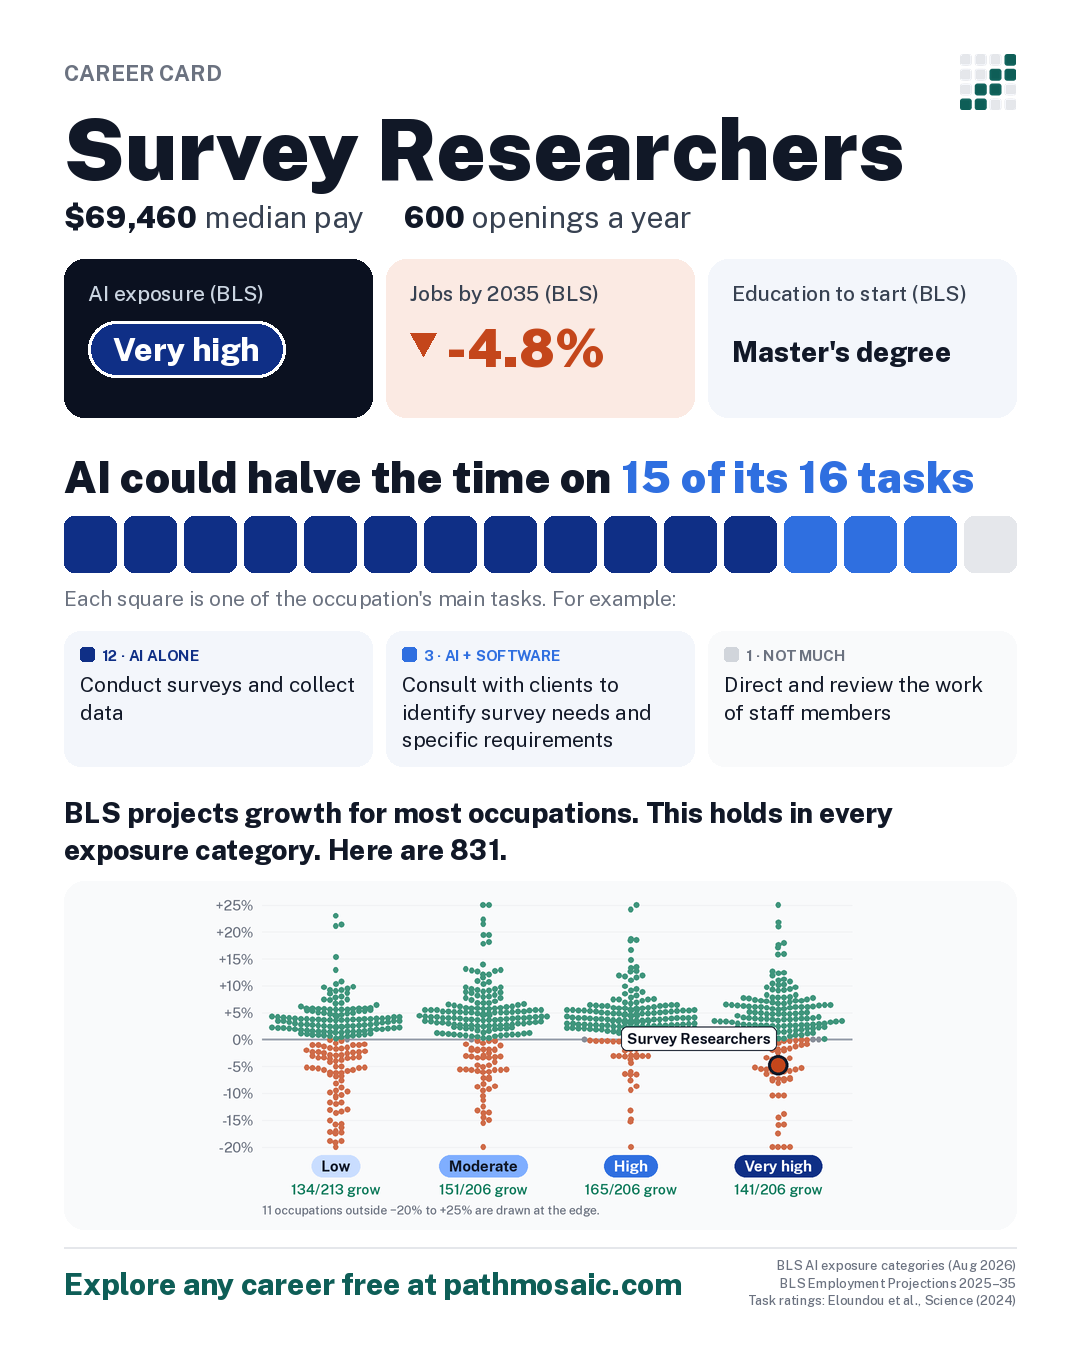
What the data says: AI could halve the time on 15 of its 16 tasks, and jobs are projected to shrink 4.8% by 2035. In the most exposed occupations, the squeeze shows up first among early-career workers. How to think about this →
About this projection
BLS builds AI into its projections where the research supports it: “BLS generally applies adjustments based on this research conservatively, where there is convincing evidence for a change.”
It also notes a limit: “BLS projection methods are not designed to capture extremely rapid technological change.”
On its AI exposure groups, BLS says exposure “does not imply job loss.”
Recent conditions
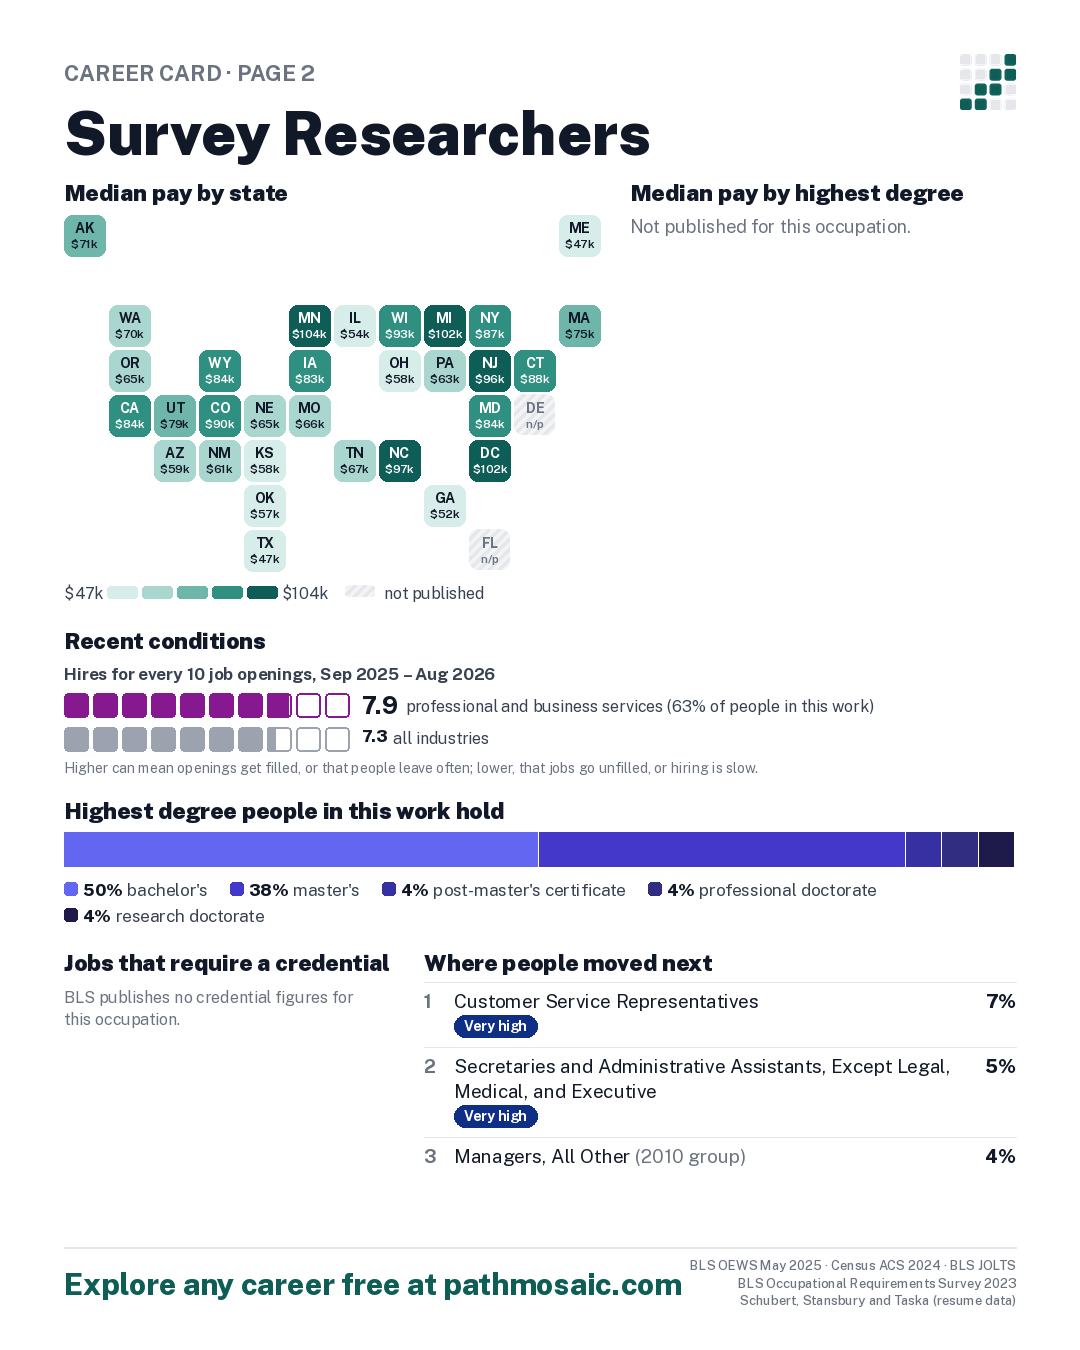
- From Sep 2025 to Aug 2026, 7.9 hires for every 10 job openings in professional and business services, which employs about 63% of people in this work, against 7.3 across all industries BLS JOLTS
One box per opening, filled for each hire; hires beyond the openings are added in a lighter shade. Higher can mean openings get filled, or that people leave often; lower, that jobs go unfilled, or hiring is slow.7.9 this industry7.3 all industries
Median pay by state BLS OEWS May 2025, state estimates
Tap a state for its figures.
Median pay in every state
| State | Median | Middle half earn | Jobs |
|---|---|---|---|
| Alaska | $70,560 | $65,900 to $76,880 | 40 |
| Arizona | $59,210 | $55,650 to $65,240 | not published |
| California | $83,520 | $68,840 to $119,090 | 1,180 |
| Colorado | $89,870 | $69,980 to $103,400 | 110 |
| Connecticut | $88,320 | $67,420 to $124,070 | 110 |
| Delaware | not published | not published | 80 |
| District of Columbia | $102,390 | $81,770 to $137,040 | 150 |
| Florida | not published | not published | 310 |
| Georgia | $51,590 | $41,780 to $67,000 | not published |
| Illinois | $54,080 | $54,080 to $104,420 | 320 |
| Iowa | $83,170 | $83,170 to $88,680 | 90 |
| Kansas | $57,700 | $47,240 to $69,100 | 210 |
| Maine | $47,330 | $35,820 to $65,860 | 60 |
| Maryland | $84,030 | $62,520 to $113,040 | 390 |
| Massachusetts | $74,890 | $55,100 to $81,240 | 160 |
| Michigan | $101,550 | $76,210 to $125,610 | 150 |
| Minnesota | $104,220 | $99,940 to $113,260 | 340 |
| Missouri | $66,460 | $38,570 to $79,760 | 130 |
| Nebraska | $64,530 | $46,770 to $77,430 | 210 |
| New Jersey | $95,580 | $77,970 to $108,840 | 100 |
| New Mexico | $61,380 | $56,830 to $71,820 | 130 |
| New York | $86,890 | $73,290 to $106,440 | 380 |
| North Carolina | $96,560 | $66,110 to $127,320 | 350 |
| Ohio | $57,630 | $41,750 to $99,760 | 320 |
| Oklahoma | $57,200 | $50,400 to $65,000 | 50 |
| Oregon | $64,660 | $60,220 to $79,500 | 190 |
| Pennsylvania | $63,310 | $51,510 to $74,030 | not published |
| Tennessee | $66,900 | $61,600 to $82,100 | 210 |
| Texas | $47,330 | $37,500 to $51,180 | 680 |
| Utah | $79,090 | $54,970 to $141,340 | 50 |
| Washington | $69,590 | $64,570 to $90,720 | 130 |
| Wisconsin | $92,660 | $73,650 to $118,170 | 60 |
| Wyoming | $84,360 | $65,730 to $84,360 | 40 |
Nationally: $69,460. Shades run from the lowest state median to the highest; a territory below that range takes the lightest. How to read this
How AI touches the work
What AI could speed up, task by task, and where people already use it.
AI could halve the time on 15 of its 16 tasks
| AI rating | Its main tasks | Share of Claude conversations May 2026 |
|---|---|---|
| AI alone | Conduct surveys and collect data, using methods such as interviews, questionnaires, focus groups, market analysis surveys, public opinion polls, literature reviews, and file reviews. | 0.01% |
| AI alone | Prepare and present summaries and analyses of survey data, including tables, graphs, and fact sheets that describe survey techniques and results. | under 0.01% |
| AI + software | Consult with clients to identify survey needs and specific requirements, such as special samples. | Not published |
| AI alone | Determine and specify details of survey projects, including sources of information, procedures to be used, and the design of survey instruments and materials. | under 0.01% |
| AI alone | Support, plan, and coordinate operations for single or multiple surveys. | Not published |
| AI + software | Monitor and evaluate survey progress and performance, using sample disposition reports and response rate calculations. | Not published |
See all 16 tasks
| AI alone | Collaborate with other researchers in the planning, implementation, and evaluation of surveys. | Not published |
| AI alone | Conduct research to gather information about survey topics. | Not published |
| Not much | Direct and review the work of staff members, including survey support staff and interviewers who gather survey data. | Not published |
| AI alone | Direct updates and changes in survey implementation and methods. | Not published |
| AI alone | Produce documentation of the questionnaire development process, data collection methods, sampling designs, and decisions related to sample statistical weighting. | Not published |
| AI + software | Analyze data from surveys, old records, or case studies, using statistical software. | Not published |
| AI alone | Review, classify, and record survey data in preparation for computer analysis. | Not published |
| AI alone | Write proposals to win new projects. | Not published |
| AI alone | Write training manuals to be used by survey interviewers. | Not published |
| AI alone | Hire and train recruiters and data collectors. | Not published |
Ordered by how important O*NET's respondents rate each task (1 to 5) times the share who say it is part of their job. The ordering is ours. 3 of the 16 have a published share of Claude conversations; “not published” means too few conversations for Anthropic to publish a figure.
Where people already use AI
The tasks above say what AI could speed up. This shows what people are using it for. Its 16 tasks fall under 16 work activities that many occupations share, and Microsoft counted how often each one came up in 200,000 conversations with its Copilot assistant in 2024.
- #8 Read documents or materials to inform work processes
- #18 Research historical or social issues
- #20 Present research or technical information
- and 2 more, in the table below
| Work activity | This occupation's tasks under it | People asked AI for help in 10,000 conversations |
AI did it for them in 10,000 conversations |
|---|---|---|---|
| Develop research plans or methodologies | |||
| Collect information about patients or clients | |||
| Read documents or materials to inform work processes | |||
| Research historical or social issues | |||
| Present research or technical information | |||
| Prepare informational or instructional materials | |||
| Research biological or ecological phenomena | |||
| Confer with clients to determine needs or order specifications |
Show all 16 activities
| Assist scientists, scholars, or technical specialists with projects or research | |||
| Prepare reports of operational or procedural activities | |||
| Analyze data to improve operations | |||
| Maintain operational records | |||
| Train others on operational or work procedures | |||
| Prepare proposals or grant applications | |||
| Direct scientific or technical activities | |||
| Supervise personnel activities |
How people in this work use Claude
What people in this work made with Claude % of conversations
- A document or report38%
- Data or a spreadsheet4%
- An explanation or answer4%
- An academic paper or thesis3%
- A presentation or slides3%
How they worked with Claude
38% of these conversations were about work. Anthropic Economic Index, May 2026.
How to read this
Work activities come from O*NET, which links every task to the broader activities it involves. Microsoft's figures are for the activity across everyone who used Copilot, not for survey researchers specifically. Copilot is a general chat assistant; dedicated coding tools are not included, so programming help is under-counted here. Activities are listed by how many of this occupation's tasks fall under them.
The task ratings say whether AI could halve the time a task takes: on its own (“AI alone”), or with software built on it (“AI + software”). They were made by people in 2023 (Eloundou et al.). Claude's share is the task's share of all Claude.ai conversations in May 2026; Anthropic doesn't publish a task with too few conversations. None of these add up to the BLS exposure group, which combines five research measures.
More in the Guide: task ratings · task order · work activities · Copilot figures · Claude
High exposure doesn't mean fewer jobs
BLS projects most occupations in its two most exposed groups to grow: 141 of 206 rated Very high and 165 of 206 rated High. Each dot is one of the 831 occupations BLS rates.
Career moves into and out of this occupation
From moves between occupations found in online resumes, 2002–2016. Career changes only: a first job after school isn't a move.
Where people moved next
of 7,170 moves out
- 1 Customer Service Representatives Very high -5.3% 7%
- 2 Secretaries and Administrative Assistants, Except Legal, Medical, and Executive Very high -6.0% 5%
- 3 Managers, All Other (2010 group) an older group BLS has since split; no exposure group today 4%
- 4 Office Clerks, General Very high -6.0% 4%
- 5 Teachers and Instructors, All Other (2010 group) an older group BLS has since split; no exposure group today 3%
Where people moved in from
of 6,801 moves in
- 1 Customer Service Representatives Very high -5.3% 6%
- 2 Cashiers High -6.5% 5%
- 3 Medical Records and Health Information Technicians (2010 group) an older group BLS has since split; no exposure group today 4%
- 4 Secretaries and Administrative Assistants, Except Legal, Medical, and Executive Very high -6.0% 4%
- 5 Office Clerks, General Very high -6.0% 4%
Resumes over-represent younger, white-collar job-seekers and moves into management. Schubert, Stansbury and Taska (resume data).
Education and training for the occupation
O*NET survey of workers in this occupation
- 50% bachelor's
- 38% master's
- 4% post-master's certificate
- 4% professional doctorate
- 4% research doctorate
O*NET 31.0 survey of workers in this occupation · 26 people answered.
9 programs, such as Institutional Research, Statistics, General and Applied Statistics, General.
See all
- Institutional Research
- Statistics, General
- Applied Statistics, General
- Research Methodology and Quantitative Methods
- Economics, General
- Applied Economics
- Business/Managerial Economics
- Business Statistics
- Marketing Research
Jobs that require a credential BLS Occupational Requirements Survey 2023
BLS publishes no credential figures for this occupation.
Look up certifications, training and licenses U.S. Department of Labor
- Certification Finder ↗ certifications CareerOneStop lists for this occupation
- Training Finder ↗ schools and programs, nationwide; narrow the place there
- License Finder ↗ licenses by state
- Apprenticeships: DOL's list of apprenticeable occupations doesn't include this one.
These open in a new tab and send only the occupation's public code. More in the Guide
BLS AI exposure categories (Aug 2026) · BLS Employment Projections 2025–35 · O*NET 31.0 · Task ratings: Eloundou et al., Science (2024) · Microsoft "Working with AI" v1.1 · Anthropic Economic Index (2026-06-26) · Schubert, Stansbury and Taska · NCES CIP–SOC · Census ACS 2024 · BLS JOLTS · Brynjolfsson, Chandar and Chen, Stanford (Aug 2026)
See it online, and explore any career: https://www.pathmosaic.com/card/19-3022.00