Food Preparation Workers
Also called: Cook, Deli Clerk (Delicatessen Clerk), Dietary Aide, Food Service Worker (FSW)Perform a variety of food preparation duties other than cooking, such as preparing cold foods and shellfish, slicing meat, and brewing coffee or tea.
On a phone, press and hold a picture to save it to Photos.
opens your phone's share sheet, where you can save both to Photos
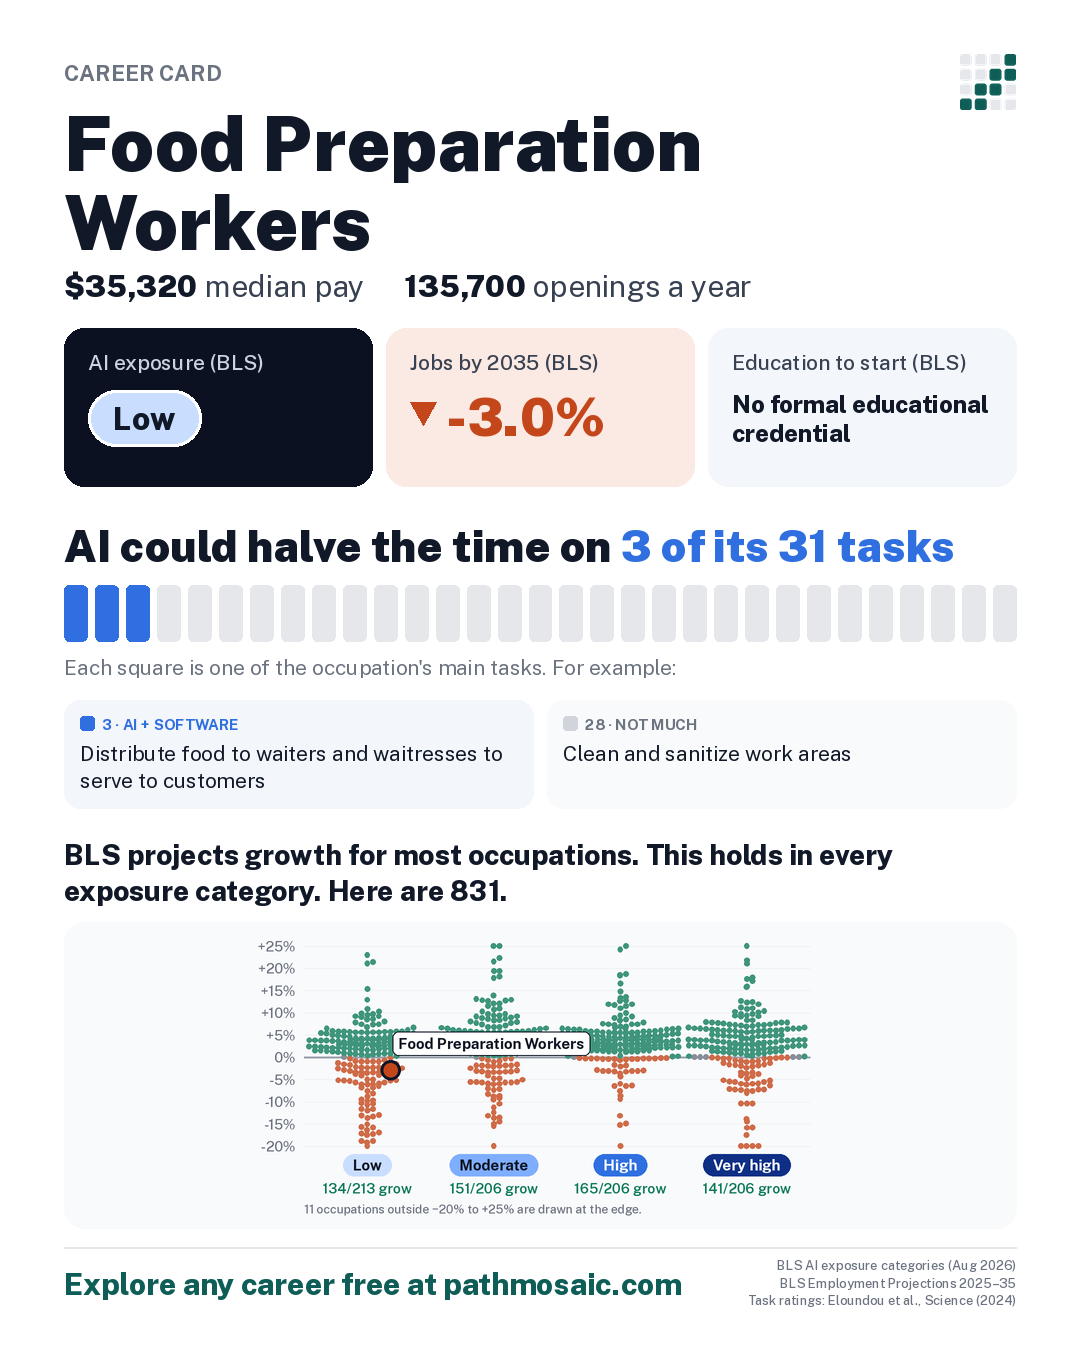
What the data says: AI could halve the time on 3 of its 31 tasks, and jobs are projected to shrink 3.0% by 2035. How to think about this →
About this projection
BLS builds AI into its projections where the research supports it: “BLS generally applies adjustments based on this research conservatively, where there is convincing evidence for a change.”
It also notes a limit: “BLS projection methods are not designed to capture extremely rapid technological change.”
On its AI exposure groups, BLS says exposure “does not imply job loss.”
Recent conditions
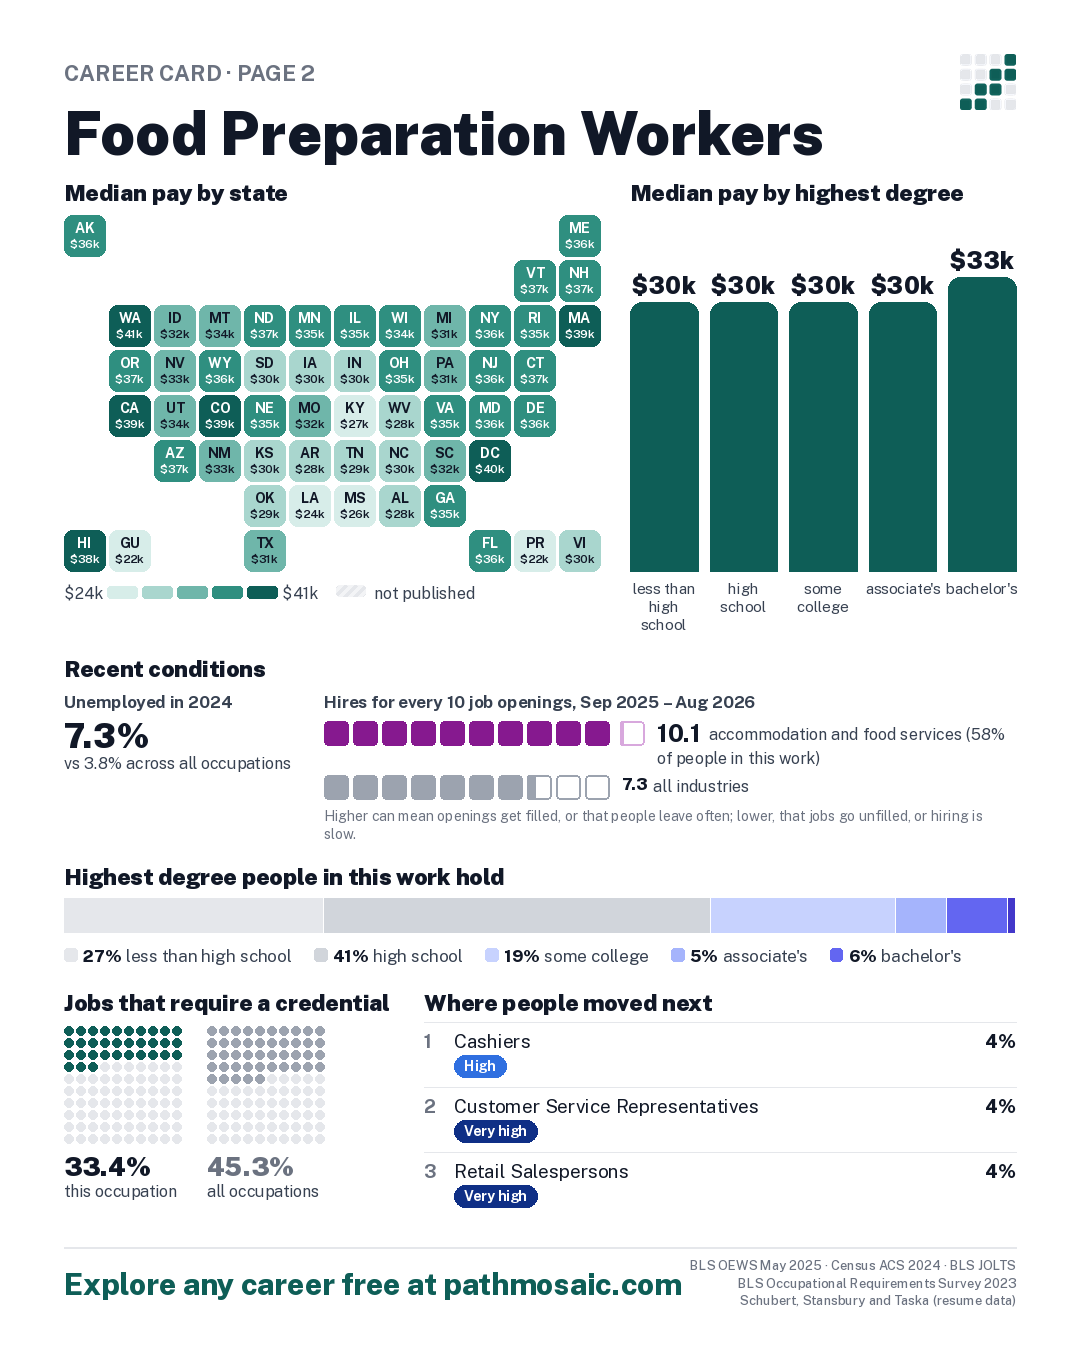
- In 2024, 7.3% of people in this work were unemployed, against 3.8% across all occupations Census ACS 2024
- From Sep 2025 to Aug 2026, 10.1 hires for every 10 job openings in accommodation and food services, which employs about 58% of people in this work, against 7.3 across all industries BLS JOLTS
One box per opening, filled for each hire; hires beyond the openings are added in a lighter shade. Higher can mean openings get filled, or that people leave often; lower, that jobs go unfilled, or hiring is slow.10.1 this industry7.3 all industries
Median pay by state BLS OEWS May 2025, state estimates
Tap a state for its figures.
Median pay in every state
| State | Median | Middle half earn | Jobs |
|---|---|---|---|
| Alabama | $27,930 | $22,000 to $34,490 | 17,680 |
| Alaska | $35,720 | $34,000 to $38,610 | 2,800 |
| Arizona | $36,750 | $34,220 to $39,160 | 16,590 |
| Arkansas | $27,660 | $25,900 to $32,390 | 5,500 |
| California | $39,350 | $37,010 to $44,540 | 112,750 |
| Colorado | $38,960 | $34,690 to $44,740 | 12,080 |
| Connecticut | $36,650 | $35,340 to $40,210 | 12,250 |
| Delaware | $35,930 | $31,860 to $38,140 | 2,400 |
| District of Columbia | $39,600 | $38,070 to $44,040 | 3,970 |
| Florida | $35,920 | $30,420 to $37,440 | 73,100 |
| Georgia | $35,250 | $29,610 to $37,700 | 26,450 |
| Guam | $21,820 | $21,240 to $22,580 | 530 |
| Hawaii | $38,160 | $33,310 to $46,920 | 5,950 |
| Idaho | $31,510 | $27,530 to $36,850 | 4,670 |
| Illinois | $34,850 | $31,200 to $37,880 | 34,820 |
| Indiana | $29,700 | $27,550 to $35,930 | 16,200 |
| Iowa | $30,360 | $28,260 to $36,200 | 4,170 |
| Kansas | $30,280 | $27,700 to $35,290 | 7,680 |
| Kentucky | $26,850 | $22,790 to $33,890 | 15,390 |
| Louisiana | $23,620 | $21,480 to $28,670 | 30,920 |
| Maine | $36,030 | $33,760 to $39,060 | 4,560 |
| Maryland | $35,500 | $33,020 to $38,470 | 13,280 |
| Massachusetts | $38,900 | $36,060 to $44,580 | 13,620 |
| Michigan | $31,180 | $27,690 to $35,910 | 17,380 |
| Minnesota | $34,850 | $30,550 to $38,240 | 24,620 |
| Mississippi | $26,240 | $21,430 to $30,100 | 7,870 |
| Missouri | $31,510 | $29,220 to $37,050 | 13,650 |
| Montana | $33,860 | $28,710 to $37,110 | 2,990 |
| Nebraska | $35,210 | $29,870 to $37,440 | 6,890 |
| Nevada | $33,460 | $28,870 to $40,920 | 11,420 |
| New Hampshire | $36,780 | $31,000 to $39,330 | 3,420 |
| New Jersey | $35,540 | $33,530 to $38,470 | 24,730 |
| New Mexico | $33,370 | $28,590 to $35,840 | 6,850 |
| New York | $35,610 | $34,320 to $40,250 | 62,380 |
| North Carolina | $30,260 | $26,610 to $36,120 | 24,960 |
| North Dakota | $36,800 | $31,510 to $38,430 | 980 |
| Ohio | $34,530 | $28,930 to $38,070 | 19,480 |
| Oklahoma | $28,540 | $22,870 to $33,960 | 7,430 |
| Oregon | $37,450 | $35,100 to $42,860 | 11,860 |
| Pennsylvania | $30,840 | $27,830 to $36,080 | 17,940 |
| Puerto Rico | $22,400 | $21,840 to $23,250 | 4,130 |
| Rhode Island | $35,470 | $32,200 to $42,030 | 2,830 |
| South Carolina | $32,180 | $27,860 to $36,970 | 14,460 |
| South Dakota | $30,430 | $28,170 to $34,140 | 3,270 |
| Tennessee | $28,700 | $24,350 to $35,820 | 19,780 |
| Texas | $30,650 | $27,110 to $37,050 | 81,280 |
| Utah | $33,540 | $29,770 to $38,400 | 10,530 |
| Vermont | $36,550 | $35,220 to $42,920 | 1,350 |
| Virgin Islands | $30,460 | $28,540 to $31,220 | 390 |
| Virginia | $34,900 | $30,940 to $37,310 | 16,340 |
| Washington | $40,910 | $35,880 to $47,390 | 19,510 |
| West Virginia | $28,360 | $23,280 to $31,380 | 2,960 |
| Wisconsin | $34,070 | $28,870 to $37,940 | 17,990 |
| Wyoming | $36,110 | $30,920 to $39,610 | 1,620 |
Nationally: $35,320. Shades run from the lowest state median to the highest; a territory below that range takes the lightest. How to read this
How AI touches the work
What AI could speed up, task by task, and where people already use it.
AI could halve the time on 3 of its 31 tasks
| AI rating | Its main tasks | Share of Claude conversations May 2026 |
|---|---|---|
| Not much | Clean and sanitize work areas, equipment, utensils, dishes, or silverware. | Not published |
| Not much | Carry food supplies, equipment, and utensils to and from storage and work areas. | Not published |
| Not much | Remove trash and clean kitchen garbage containers. | Not published |
| Not much | Store food in designated containers and storage areas to prevent spoilage. | Not published |
| Not much | Assist cooks and kitchen staff with various tasks as needed, and provide cooks with needed items. | Not published |
| AI + software | Inform supervisors when equipment is not working properly and when food and supplies are getting low, and order needed items. | Not published |
See all 31 tasks
| Not much | Weigh or measure ingredients. | under 0.01% |
| Not much | Vacuum dining area and sweep and mop kitchen floor. | Not published |
| Not much | Wash, peel, and cut various foods, such as fruits and vegetables, to prepare for cooking or serving. | Not published |
| Not much | Receive and store food supplies, equipment, and utensils in refrigerators, cupboards, and other storage areas. | Not published |
| Not much | Take and record temperature of food and food storage areas, such as refrigerators and freezers. | Not published |
| Not much | Use manual or electric appliances to clean, peel, slice, and trim foods. | Not published |
| Not much | Load dishes, glasses, and tableware into dishwashing machines. | Not published |
| Not much | Place food trays over food warmers for immediate service, or store them in refrigerated storage cabinets. | Not published |
| Not much | Stock cupboards and refrigerators, and tend salad bars and buffet meals. | Not published |
| Not much | Stir and strain soups and sauces. | Not published |
| Not much | Scrape leftovers from dishes into garbage containers. | Not published |
| Not much | Prepare a variety of foods, such as meats, vegetables, or desserts, according to customers' orders or supervisors' instructions, following approved procedures. | Not published |
| Not much | Mix ingredients for green salads, molded fruit salads, vegetable salads, and pasta salads. | Not published |
| Not much | Assemble meal trays with foods in accordance with patients' diets. | Not published |
| AI + software | Distribute food to waiters and waitresses to serve to customers. | Not published |
| Not much | Portion and wrap food, or place it directly on plates for service to patrons. | Not published |
| Not much | Add cutlery, napkins, food, and other items to trays on assembly lines in hospitals, cafeterias, airline kitchens, and similar establishments. | Not published |
| Not much | Prepare and serve a variety of beverages, such as coffee, tea, and soft drinks. | Not published |
| Not much | Make special dressings and sauces as condiments for sandwiches. | Not published |
| AI + software | Keep records of the quantities of food used. | under 0.01% |
| Not much | Cut, slice or grind meat, poultry, and seafood to prepare for cooking. | Not published |
| Not much | Distribute menus to hospital patients, collect diet sheets, and deliver food trays and snacks to nursing units or directly to patients. | Not published |
| Not much | Package take-out foods or serve food to customers. | Not published |
| Not much | Butcher and clean fowl, fish, poultry, and shellfish to prepare for cooking or serving. | Not published |
| Not much | Operate cash register, handle money, and give correct change. | Not published |
Ordered by how important O*NET's respondents rate each task (1 to 5) times the share who say it is part of their job. The ordering is ours. 2 of the 31 have a published share of Claude conversations; “not published” means too few conversations for Anthropic to publish a figure.
Where people already use AI
The tasks above say what AI could speed up. This shows what people are using it for. Its 31 tasks fall under 16 work activities that many occupations share, and Microsoft counted how often each one came up in 200,000 conversations with its Copilot assistant in 2024.
- #11 Provide information to guests, clients, or customers
| Work activity | This occupation's tasks under it | People asked AI for help in 10,000 conversations |
AI did it for them in 10,000 conversations |
|---|---|---|---|
| Prepare foods or beverages | |||
| Stock supplies or products | |||
| Clean workpieces, finished products, or other objects | |||
| Clean tools, equipment, facilities, or work areas | |||
| Dispose of waste or debris | |||
| Provide food or beverage services | |||
| Package objects | |||
| Provide information to guests, clients, or customers |
Show all 16 activities
| Prepare mixtures or solutions | |||
| Communicate with others about operational plans or activities | |||
| Execute financial transactions | |||
| Measure physical characteristics of materials, products, or equipment | |||
| Maintain operational records | |||
| Monitor equipment operation | |||
| Distribute materials, supplies, or resources | |||
| Move materials, equipment, or supplies |
How people in this work use Claude
What people in this work made with Claude % of conversations
- Data or a spreadsheet35%
- A recipe or meal plan23%
- An explanation or answer11%
- Math or a calculation10%
- An app or website6%
How they worked with Claude
5% of these conversations were about work. Anthropic Economic Index, May 2026.
How to read this
Work activities come from O*NET, which links every task to the broader activities it involves. Microsoft's figures are for the activity across everyone who used Copilot, not for food preparation workers specifically. Copilot is a general chat assistant; dedicated coding tools are not included, so programming help is under-counted here. Activities are listed by how many of this occupation's tasks fall under them.
The task ratings say whether AI could halve the time a task takes: on its own (“AI alone”), or with software built on it (“AI + software”). They were made by people in 2023 (Eloundou et al.). Claude's share is the task's share of all Claude.ai conversations in May 2026; Anthropic doesn't publish a task with too few conversations. None of these add up to the BLS exposure group, which combines five research measures.
More in the Guide: task ratings · task order · work activities · Copilot figures · Claude
High exposure doesn't mean fewer jobs
BLS projects most occupations in its two most exposed groups to grow: 141 of 206 rated Very high and 165 of 206 rated High. Each dot is one of the 831 occupations BLS rates.
Career moves into and out of this occupation
From moves between occupations found in online resumes, 2002–2016. Career changes only: a first job after school isn't a move.
Where people moved next
of 61,773 moves out
- 1 Cashiers High -6.5% 4%
- 2 Customer Service Representatives Very high -5.3% 4%
- 3 Retail Salespersons Very high -0.3% 4%
- 4 Food Service Managers Moderate +5.8% 4%
- 5 Waiters and Waitresses Moderate +2.0% 3%
Where people moved in from
of 42,789 moves in
- 1 Cashiers High -6.5% 8%
- 2 Waiters and Waitresses Moderate +2.0% 5%
- 3 Customer Service Representatives Very high -5.3% 4%
- 4 Retail Salespersons Very high -0.3% 4%
- 5 Fast Food and Counter Workers Moderate +5.8% 4%
Resumes over-represent younger, white-collar job-seekers and moves into management. Schubert, Stansbury and Taska (resume data).
Education and training for the occupation
O*NET survey of workers in this occupation
- 3% less than high school
- 1% postsecondary certificate
- 4% research doctorate
- 92% not published
O*NET marks 92% of the answers as too uncertain to publish, so the parts shown don't add up to 100%.
O*NET 31.0 survey of workers in this occupation · 17 people answered.
Census survey (American Community Survey)
- 27% less than high school
- 41% high school
- 19% some college
- 5% associate's
- 6% bachelor's
- 1% master's
Census ACS 2024, all workers in this occupation · 9,196 people surveyed.
Why the two can differ
O*NET asks about 20 people in each occupation, which makes its shares uncertain, but it reports the exact occupation and counts certificates. The Census survey reaches thousands, but it groups some occupations together and counts degrees only. More in the Guide
Median pay by highest degree full-time, year-round · Census ACS 2024, all workers in this occupation
Jobs that require a credential BLS Occupational Requirements Survey 2023
33.4% this occupation
45.3% all occupations
| By kind | This occupation | All occupations |
|---|---|---|
| a license | <0.5% | 19.1% |
| a certification | <0.5% | 5.8% |
| an educational certificate | not published |
Share of jobs whose employer requires it. BLS doesn't say which credential. How to read this
Look up certifications, training and licenses U.S. Department of Labor
- Certification Finder ↗ certifications CareerOneStop lists for this occupation
- Training Finder ↗ schools and programs, nationwide; narrow the place there
- License Finder ↗ licenses by state
- Apprenticeships: DOL's list of apprenticeable occupations doesn't include this one.
These open in a new tab and send only the occupation's public code. More in the Guide
BLS AI exposure categories (Aug 2026) · BLS Employment Projections 2025–35 · O*NET 31.0 · Task ratings: Eloundou et al., Science (2024) · Microsoft "Working with AI" v1.1 · Anthropic Economic Index (2026-06-26) · Schubert, Stansbury and Taska · NCES CIP–SOC · Census ACS 2024 · BLS JOLTS
See it online, and explore any career: https://www.pathmosaic.com/card/35-2021.00